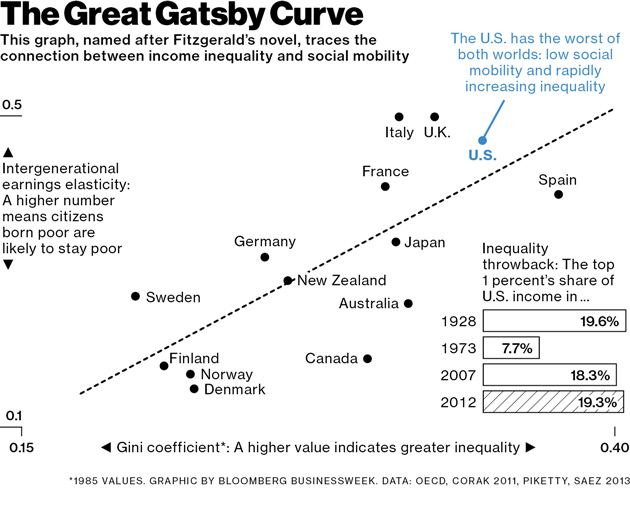
The Great Gatsby Curve : Bloomberg Businessweeks’s Christmas present for all we left-wing kooks
Dec 18th, 2013 | By Counterweights Editors | Category: In Brief Here in the new wild-and-crazy City of Toronto “left-wing kooks” is a term most memorably applied by the dean of Canadian hockey commentators, Don Cherry, at the inauguration of Mayor Rob Ford, some three years ago now.
(As in : “Rob’s honest, he’s truthful…I say he’s going to be the greatest mayor this city has ever seen as far as I’m concerned. And put that in your pipe you left-wing kooks.”)
Whatever you think about the species – and most of us here would probably qualify, in one way or another – you almost certainly have to agree that Brendan Greeley has done us a favour in his December 12, 2013 post on the Bloomberg Businesweek website, “The Gatsby Curve: How Inequality Became a Household Word.”
Five or 10 minutes’ pondering of the accompanying graphic exhibit (see above) ought to make the message more or less clear. (Generally, the closer a country is to the bottom of the dotted line, the more socially mobile and less economically unequal it is. As in so much other data of this sort, the Scandanavian countries in northern Europe do best ; Germany and the old Commonwealth dominions of Canada, Australia, and New Zealand are not too bad ; and the United States and the United Kingdom are among the worst.)
Greeley’s piece tells the full story and is well worth the few additional minutes it takes to read it. (CLICK HERE.) If you are absolutely averse to this prospect, here are two tantalizing excerpts:
(1) “For much of the 20th century, academic economists accepted the ideas of Simon Kuznets … In the 1950s, Kuznets looked at IRS returns going back to the introduction of the personal income tax in 1913 and discovered that income inequality had been dropping in the US. He suggested that for developed economies, economic growth lowered inequality. ‘It was a nice theory for the golden age of growth,’ says Thomas Piketty, a professor at the Paris School of Economics … Piketty … applied Kuznets’s approach to tax data for his native France, eventually running it all the way forward to 1998. Then, with Emmanuel Saez, another French economist, he did the same for the US. In 2003 they published their finding that income inequality had started to rise in America in the early 1980s.”
(Mmmm … and what was happening in both the the UK and the US in the 1980s? Remember the aggressive and almost mindless free-market revivalism of Margaret Thatcher and Ronald Reagan? That at least is what a left-wing kook might reasonably draw from “The Great Gatsby Curve” – so named because in the US by “2007 the income share of the top 1 percent had reached a level not seen since 1928, the Jazz Age of F. Scott Fitzgerald’s Jay Gatsby.”)
(2) “In the late 1990s, Miles Corak at the University of Ottawa applied that approach to Canada. He also began the complicated econometric work necessary to compare social mobility among countries. Corak made it possible to see whether the American Dream measured up to the Danish Dream. (It doesn’t.) In 2004 … Corak produced the first version of a graph that compared developed economies according to income inequality and social mobility. The graph shows that countries with the highest income inequality, such as the UK and the US, are also the most likely to pass economic status from one generation to another.”
(And now in Canada over the next two years, we left-wing kooks no doubt have to say, at least one great public policy question ought to be : Is the vision of the Stephen Harper Conservatives moving us closer to the UK and the US – or closer to the Danish Dream? In any case, for all our friends in Ottawa, Happy New Year 2014! Oh and btw, for another current version of a graph that compares “developed economies according to income inequality and social mobility” see “Miles Corak: Inequality and life chances,” published by the Broadbent Blog about this time last year, here in our home and native land.)


